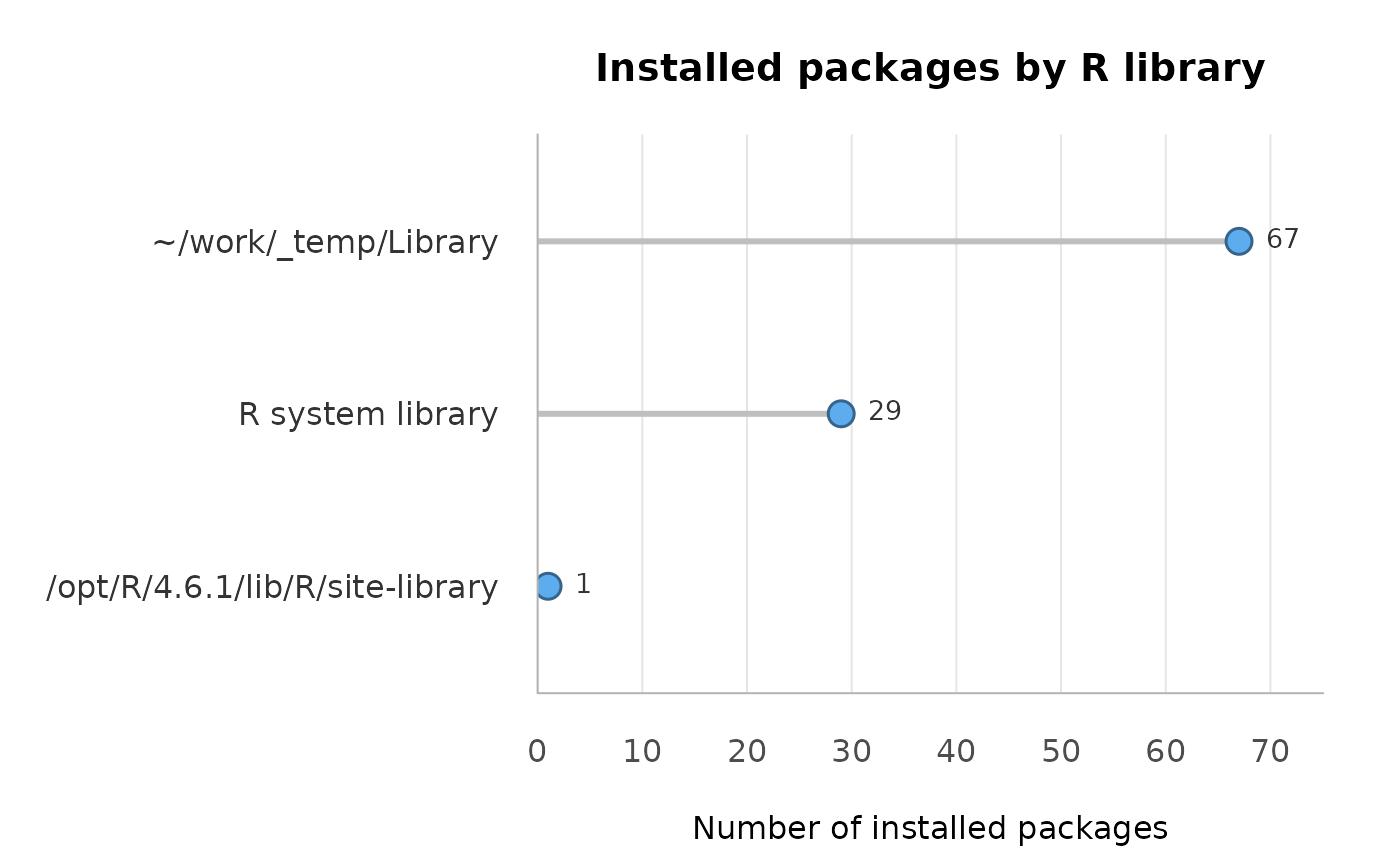
Draws a horizontal dot plot showing the number of installed packages in each R library. Library paths are shortened to keep the labels readable.
Usage
plot_libraries(data = lib_summary(), main = "Installed packages by R library")Arguments
- data
A data frame returned by
lib_summary(). By default, a new summary is created.- main
Character string giving the plot title.